Instruction for the programs for calculation of parameters helpful in radionuclide therapies (f.e. radioiodine therapy of the thyroid)
This is a handbook for the algorithms for calculation of diverse parameters helpful in planing of a radionuclide therapy. Since the radioiodine therapy of the thyroid is the most common radionuclide therapy, it will be used as the model for further explanations.
Theoretical basis
Iodine is taken up by the thyroid and used in the processes related to hormone biosynthesis. More information on these processes are accessible here (in Polish). The iodine has to spend a particular time in the thyroid to be able to undergo these processes. The so called biological half-time (T(1/2)biol) of iodine in a normally functioning thyroid equals about 2-3 weeks. In pathology, it can be changed: in hyperthyreosis (hyperthyroidism), it can be shortened to a few days.
Radioiodine (in most cases: 131I) obeys the same rules of (bio)chemical changes in the organ. The only difference is that the physical decay overlaps with the biological elimination. The physical half-time (T(1/2)phys) of iodine-131 is about 8 days. It makes the so called effective half-time (T(1/2)ef) about 5,5-6 days (reciprocal of the effective half-time T(1/2)ef equals to the sum of reciprocals of times: physical T(1/2)phys, and biological T(1/2)biol):
1/T(1/2)ef = 1/T(1/2)phys + 1/T(1/2)biol.
An example (theoretical) of radioiodine activity measured over the thyroid (with hyperthyroidism) has been shown on the chart below. The pink line is the activity curve, what would be measured, if the thyroid took up (immediately after administration)
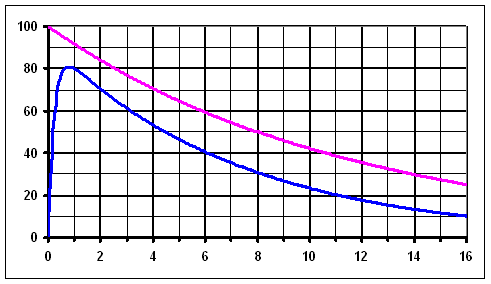
Activity of 131I measured over the thyroid (example) - blue line. After it reaches the peak, it is almost exponential. For comparison: physical decay of 131I (pink line) - exponential curve.
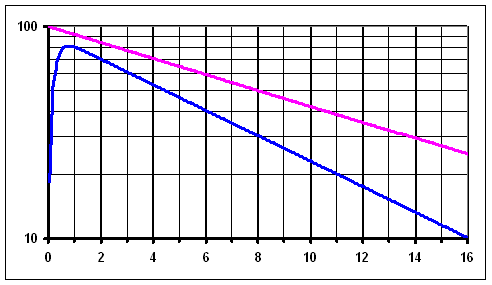
Activity of 131I measured over the thyroid and the physical decay - as on the chart above, but in logarithmic scale. The curve of the physical decay (pink) is a straight line, the curve from over the thyroid is almost straight after it reaches the maximal value.
Knowing of some parameters, as the maximal uptake and the effective half-time, makes it possible to precisely calculate the radiation dose, which is obtained in a given organ; the dose equals to the amount of ionization energy delivered to the given mass. Of course, it is also possible to inversely calculate the quantity of a radionuclide, which is necessary to obtain a planned radiation dose in the organ. Because the density of the bulk of tissues (including the thyroid) is about 1 g/ml (1 g/cm3), it can be assumed that 1 g ≈ 1 ml.
Performing of measures
Correct measure technique is the basis for obtaining of reliable results. The measures should be performed always in the same distance
Activity peak of 131I in a healthy thyroid is variable and is frequently placed about 1 day after its oral application, the uptake is
The dynamics of increasing and the decreasing of the activity of another nuclide in another organ is, of course, different. It depends from the nuclide, the organ, and the application route. General rules are, however, the same.
Instructions for the programs
Launching
In order to start an appropriate program, it is necessary to choose "CALCULATOR" from the main menu of our web-site. The right program can be chosen in "Calculations related to nuclear medicine", one click of the left mouse key launches the program. If you need to use more than one program at the same time, you can click with the right mouse key and choose "open in new window" or "open in new card".
Calculation of thyroid volume (1.)
This program was designed for calculation of the thyroid volume, but it is possible to calculate with its help a volume of other structures, f.e. nodes. One should enter the diameters of the both lobes (or f.e. a node...) in millimeters, the result will be converted into milliliters (cm3). The calculation is performed according to a simplified formula for the volume of an ellipsoid: multiplication of the three perpendicular to each other diameters (not radii!) and division by two.
Calculation of (radio)nuclide uptake (2.)
This program calculates the uptake of a radiotracer applicated to the patient, in a given organ. Besides, it calculates the uptake of tracer (how high
The information you want to get implies the parameters you have to enter. In the simpliest version, you may write only the nuclide measures
As the calibration/application time, you should write: year (four-digit format), month (two-digit format), day (two-digit format), hour (two-digit format) and minute (two-digit format)
The most important parameters for further calculations (f.e. effective half-time - option 4) are: radiotracer uptake [%] and the time interval between calibration/application and patient measure as expressed in hours.
Calculation of the radioiodine dose (simplified - 3.)
It is a very simplified (and inprecise) method of calculation of iodine-131 dose for therapy of benign thyroid disorders, if only one uptake of 131I
Kinetic modeling of a radiotracer in an organ I. -
effective half-time, maximal uptake,
and half-time of the radiotracer influx (4.)
The program calculates the approximate effective half-time of a nuclide in an organ (first three steps). Multiple uptake measures of the patient are necessary. Not only a calculation of this parameter for the test nuclide is possible, but also a conversion into another one ("therapy nuclide"). However, such a procedure can result in an error - especially, when the test nuclide has remarkably shorter physical half-time than the therapy nuclide (f.e. 123I as the test nuclide and 131I as the therapy nuclide).
The last (optional) step is for correction related to taking into consideration of the influx of the radiotracer into the organ. The programm was designed in such a way, that there are as little as possible modifications in comparison to the widely known and accepted models. The calculations related to the influx are right mainly on the following kinetics conditions:
- intravenous bolus administration ot the radiotracer,
- the concentration of the radiotracer in the blood in the function of time diminishes exponentially,
- the rate of the radiotracer influx into the organ from the blood ist proportional to its concentration in the blood,
- the rate of the radiotracer elimination from the organ is proportional to its content in the organ.
The quantity of the radiotracer in the organ in the function of time in this model can be described with the following formula (which is a modified Bateman formula for the second radionuclide in a chain):
| Ut = F (2-t/T(1/2)ef - 2-t/T(1/2)a) |
Ut - uptake of the radiotracer in the organ in the function of time (t)
T(1/2)ef - effective half-time of the radiotracer in the organ
T(1/2)a - half-time of the radiotracer influx into the organ
F - proportionality coefficient.
The both times (T(1/2)ef and T(1/2)a) have to differ from each other; if T(1/2)a is shorter than T(1/2)ef, the factor F is positive. The area under the curve described with the formula corresponds to the number of radioactive disintegrations ("cumulated activity" - deposited energy) in the organ.
The program can make a comparison between the numbers of radioactive disintegrations calculated with the above more precise model and the formerly known one, which takes into account the effective half-time only:
| Ut = Umax 2-t/T(1/2)ef |
Umax - maximal uptake.
The ratio of the number of disintegrations calculated with the more precise model to the number obtained by use of the simplier method was called the "correction factor" (Cf).
As mentioned above, the operation of the program goes by three following steps. In each step, you have to click the "send"-button in order to go to the next one. If there is a necessity to correct the data in a preceding step, you may just change the data in the appropriate form field(s) and click the appropriate "send"-button; data entered in next steps will be automatically deleted.
Step one
Enter the patient data; for data safety, it is recommended to use an encoded number instead of the surname. Choose the test nuclide (choice: "131I" or "another"). In the case of 131I, the physical half-time (T(1/2)phys) of the test nuclide will appear automatically (8.02 days). If the option "another" is chosen, you have to specity the T(1/2)phys - write the number and select the time unit: hours (h) or days (d). For example: for a nuclide with T(1/2)phys 3 days write the number "3" into the first form field and select "days" in the second field; alternatively write "72" in the first field and select "hours"
If iodine-131 is chosen as the test nuclide, a possibility to enter a physical half-time different from 8.02 days will be blocked. Breaking of this blockade is possible (by disabling of java script in the browser), but such data will be ignored by the server.
Write the number of patient measures you have done. After you filled the form out, click the "send"-button.
Step two
You have to enter the results of the patient measures. A table form will be displayed - the number of lines will equal to the number of measures (entered in the preceding step). Enter the number of hours elapsed from the calibration/application into the "time"-field, enter the uptake value (%) for each measure in the field "uptake". For practical reasons, only the time values between 0-360 hours (15 days) and the uptake values between 0.01-100% will be accepted. It is recommended to enter the measure values in chronological order.
In order to get the demanded values for the form, you have to click with the RIGHT mouse button the point 2 (Calculation of radionuclide uptake,
The necessity of correct data entering must be emphasized. In "time"-field of the form, you have to enter the time elapsed from calibration/application expressed in hours, in the field "uptake" enter the "radiotracer uptake" (not the decay-corrected "tracer uptake").
Click the "send"-button at the end.
Step three
Next (two-part) form and a chart of entered measure values with a legend will be displayed.
The first part of the form contains the entered results of measures (three columns). In the 4th column ("max. uptake"), you have to check, whether the default chosen uptake value is the highest one (and correct it, if necessary). In the last column ("T(1/2)ef"), you have to label these uptake values, which should be taken into account for calculation of the effective half-time of the test nuclide in the organ. The chart below can be helpful in the decision. You have to label at least TWO values. They should be placed AFTER the maximal value (and far from it) and lie more or less on ONE straight line (whose fall is more steep than that of the physical decay) - it makes possible that the calculated T(1/2)ef is reliable. Since the line of T(1/2)ef is straight-shaped on the logarithmic chart, it is possible to calculate the line with the method of least squares.
Because the T(1/2)ef is calculated mainly for planning of a radionuclide therapy, and the therapy itself can sometimes be performed with a different nuclide than the test, you can specify the "therapy nuclide" in the second part of the form ("the same" or "another" as in the test). If you choose the option "another", you have
After you send the data, the results will be displayed: the maximal uptake and the calculated effective half-time of the test nuclide - expressed in hours and days. If the calculated T(1/2)ef is not higher than 99% of the physical half-time (T(1/2)phys), next parameters will be calculated: the tracer uptake ("non-radioactive nuclide"), the therapy nuclide uptake, the half-time T(1/2) of the tracer (corresponding to T(1/2)biol) and the T(1/2)ef of the therapy nuclide. It will be displayed in a frame, whose content can be copied to a word-processing program and printed out.
Step four
The calculated T(1/2)ef can be optionally modified in the step four. A form-table is displayed. In its first row (except for the head) - marked grey, the (non-modificable) calculated value of T(1/2)ef appears. In the next (white) row, there is a value of T(1/2)ef, which can be modified (use rather point than comma as the decimal separator - dependent from the browser settings). In the third (marked grey and non-modificable) row, there is a calculated ratio of the modified to originally calculated half-time.
During entering of a value into a cell of the second row (left column - T(1/2)ef expressed in hours, right - in days), the values in other cells (the third row and the other cell of the second row: right or left, respectively) is being modified automatically. The appearing values should be seen as auxillary. For the proper working of the program, however, the modified value of T(1/2)ef expressed in hours (red border of the cell) is the most important. It should be kept in mind, if java script is disabled in the browser.
Sending od the form of the step four with no modifications implies the acceptance of the calculated value of the effective half-time of the test nuclide.
Step five
Optionally, you can enter the half-time of the influx of the radiotracer into the organ (T(1/2)a) expressed in hours. If it is possible to suggest this value on the basis of the uptake values, which precede the maximal uptake, a table with the suggested values of T(1/2)a is displayed (calculated using an iterative method). In a case, when there are known multiple uptake values, which precede the maximal uptake, the suggested T(1/2)a-values should be similar for each of them. Otherwise, the following problems should be considered:
- the kinetics of the radiotracer in the organ does not follow the conditions listed above,
- the T(1/2)ef was calculated / corrected incorrectly (you can go back to the step four),
- the results of the measures are erroneous.
A value of T(1/2)a ranging from 0.0001 T(1/2)ef to 0.9 T(1/2)ef can be accepted in the form.
Results
After you go through all the five steps, your result (two tables and two charts) is displayed. In the first table, for each tracer (test nuclide, non-radioactive tracer and therapy nuclide), the following data are shown: effective half-time (for the non-radioactive tracer, it is the biological half-time), half-time of the influx, and proportionality coefficient F. For the T(1/2)ef of the test nuclide, it is also displayed, whether the time was calculated or corrected; in the second case, it is shown, by which factor it was corrected and how long is the originally calculated time. In the column "Simulated maximal uptake", the parameters of the "peaks" of relevant curves are shown; these data are auxillary only. For eventual dosimetric calculations, the numbers given in the penultimate column ("Measured / re-calculated maximal uptake") are the most important. The correction coefficients Cf (the last column) concern to these values. This allows to directly compare the traditional dosimetric method to the proposed one.
The next table presents the entered measure results (test radiotracer) and re-calculated uptake values of the non-radioactive tracer and the therapy radiotracer. These data arose through an easy division / multiplication of the entered uptake values by appropriate decay factors. Below each row, simulated uptake values (calculated based on the curve parameters) in the given time points ("how high could be the uptake, if it was ideally on the calculated curve") are shown for comparison. Higher similarities between the both sets of values are a testimony for a more correct simulation (in ideal pharmacokinetics conditions). The maximal uptake values (which should be considered in further dosimetric calculations) are written using bold fonts.
On the first chart, the entered measure values (the points taken for calculation of T(1/2)ef are marked) and the generated T(1/2)ef-line (before correction) are presented (in logarithmic scale). On the next chart, the entered measure values and the simulated curves are shown. During the calculation of the parameters for the curve of the test nuclide, it was assumed that the curve should cross the point lying on the time of the last (chronologically) measure and on an uptake-value on the generated T(1/2)ef-line.
Example 1
For the test nuclide I-131, in order to simulate a therapy nuclide I-133 (T(1/2)phys: 20.83 h, arising Xe-133 is to neglect), the following six measure values are entered:
| measure number | time [h] | uptake [%] |
|---|---|---|
| 1 | ||
| 2 | ||
| 3 | ||
| 4 | ||
| 5 | ||
| 6 |
- minimally shortens the calculated T(1/2)ef,
- causes a little lower dispersion of T(1/2)a suggested for the points 1 and 2 in the step five.
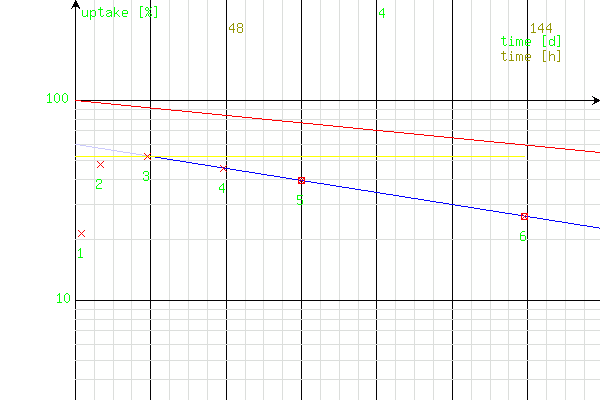
Chart 1 of the example measure results from the table abowe. The points 5 and 6 (processed for calculation of T(1/2)ef) are marked. The generated straight line of T(1/2)ef - blue.
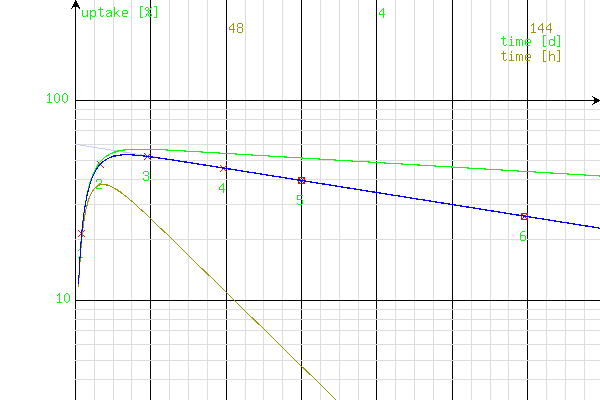
Chart 2 - simulation of curves (in the organ) of: the test radiotracer (131I, blue), the non-radioactive tracer (normal iodide - green) and the therapy radiotracer (133I, brown).
Example 2
Let us consider a next series (of only three) measures after application of iodine-131:
| measure number | time [h] | uptake [%] |
|---|---|---|
| 1 | ||
| 2 | ||
| 3 |
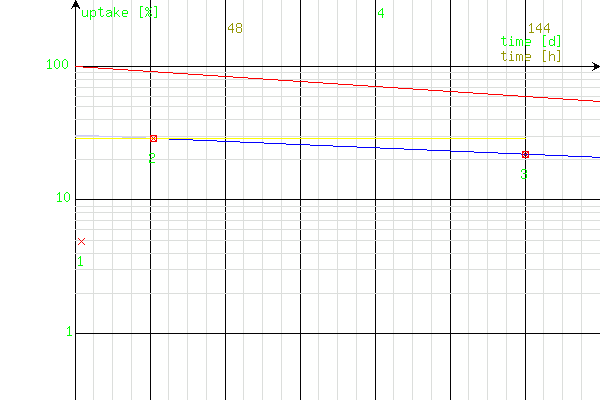
Chart for the example 2 (data in the table above); the calculated T(1/2)ef is longer than T(1/2)phys (the generated line of physical decay - red - falls more steeply than the line of the effective half-time - blue).
If the calculated T(1/2)ef is not corrected in the step four, and the suggested value (7.82 h) is accepted as T(1/2)a in the step five, the uptake-value lying on the simulated curve in the point of the maximal measured uptake will be lower not only than the measured value (25 h, 25.66 % vs. 29.01 %), but also than the simulated point of the maximal uptake (42.3 h, 27.16 %, shown together in the table displayed). This discrepancy will also be imaged on the chart.
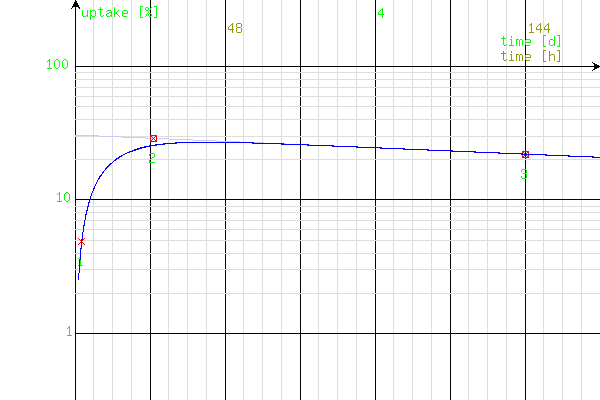
Chart for the example 2; for calculation of the curve, the suggested values with no correction were processed. The simulated curve lies under the measured value in the point 2.
This problem can be solved by a successive shortening of T(1/2)ef in the step four, accepting of the suggested value of T(1/2)a in the step five, and comparison of the obtained results in the tables and charts. In this very case, this process can be a little accelerated by a (temporary) displacement of the maximal measured uptake from the point 2 to 3 in the step three, successive correction of the T(1/2)ef in the step four, and by comparison of both suggested T(1/2)a-values in the step five; they should be the same or at least very similar. In the case above, this stand can be achieved for T(1/2)ef = 168 h (7 d) and T(1/2)a = 10 h. One must remember, however, to change the maximal uptake back to the point 2 in the step three after the appropriate values are found.
In the manual for the next program, there is presented a faster and more elegant method for solution of this problem.
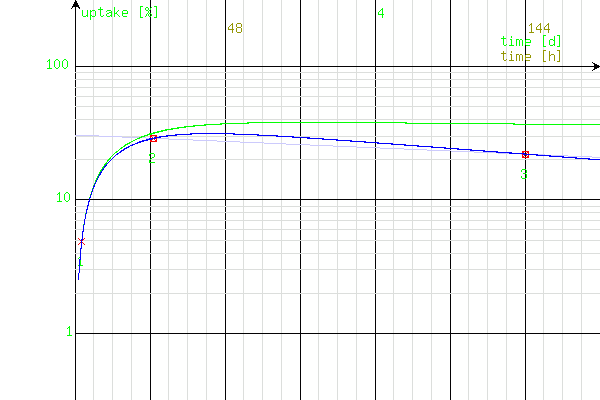
Chart for the example 2; the right parameters of the simulated curve (blue) are achieved. The curve crosses all the measure points and falls more steeply than the calculated line of T(1/2)ef (bright-blue).
The reason for so significant discrepancy between the effective half-times: calculated and corrected (which better corresponds to the true half-time) is the processing of a measure value, which lies on this part of the curve, what is still too intluenced by T(1/2)a. In this very case, one of the points (2) lies even on the ascending branch of the curve (before the maximal value), what became evident after the correction. The difference would be remarkably lower (or even negligible), if one more measure was performed (for example, 96 h after the application), and its value was processed for the calculation of T(1/2)ef instead of the point 2.
Kinetic modeling of a radiotracer in an organ II.
This program is an attempt to solve the kinetic equation of a radiotracer in an organ based on results of three measures of its uptake. The radiotracer kinetics must follow the conditions given in the manual for the preceding program (must imitate the Bateman equation for the second radionuclide in a chain). This program operates in two steps.
If three measure results (time and uptake) are known, a system of three equations with three unknowns (effective half-time: T(1/2)ef, half-time of the influx: T(1/2)a, and proportionality factor F). Because it is a system of exponential equations, it cannot be solved by an analytical method. Instead, one equation with two unknowns (both half-times) is derived from the system. Then, for each effective half time in a defined range (divided by some hundred parts), a half-time of influx (fulfilling the equation) is sought by use of a successive approximation (iterative) method. In this way, a set of solutions for the derived equation with two unknowns is obtained (visualized as a curve on a chart). Subsequently, each of these solutions (i.e., both times) are separately substituted to each of the three equations describing the measure results. Hence, the F-factor is calculated for each equation. This one solution (both times), for which the differences between the calculated factors are the lowest, is shown (vertical line on the chart) as the most probable solution.
Step one
The following data should be entered:
- results of three measures (times expressed in hours in chronological order, not more than 480 h, and uptakes expressed in percent, not less than 0.01 %);
- ranges, in which the both half-times (effective - till 480 h - and of the influx) should be sought; the latter will be sought in a value range lower than the effective time.
After the data are sent, a chart with blue or green line of T(1/2)ef → T(1/2)a is displayed. The solution of the system lies most probably on the line. A vertical line appears on this place, on which the solution should be placed. Below, suggested T(1/2)ef together with most probable deviation (corresponding to the number of parts, the examined range was divided to) is shown. Apart from this, T(1/2)a and the F-factors calculated separately for each of the entered measure points for the suggested times are presented. Higher coherency of the factors indicates a higher correctness of the result.
For a better precision, the step one can be repeated by re-sending of the data after narrowing of the range. Lack of suggested times is an indicator for incorrectness of the entered data or of the chosen data range.
Step two
This step is designed mainly for checking of correctness of the obtained results. Both half-times and the F-factor must be entered. Optionally, a fourth time-point may be entered; the uptake of the radiotracer for accepted equation parameters will be calculated. Correctness of the performed calculations can be checked in a table and on a chart. In the table, a comparison between entered and calculated (green and italics) uptakes is displayed.
Near the table and above the chart, the calculated parameters are displayed. Apart from both times and the F-factor, the maximal uptake (time and percentage, corresponding to the peak of the calculated curve) can be seen. For dosimetry, a value described as "um(1, 2, 3)" is more important. This is the maximal value of the three entered uptake values. It, together with the effective half-time, would be processed for calculation of radionuclide dose in traditional method. The correction factor for the number of decays ("cumulated activity") Cf compares the traditional method with the method presented in this program (considering also the influx and the peak of the radiotracer).
Example
Let's consider the example 2 from the previous program again. The upper limit of T(1/2)ef is set for 200 hours (physical half-time of I-131 is about 192 h), the upper limit of T(1/2)a for 20 hours; the lower limits are zero. The resulting chart is following:
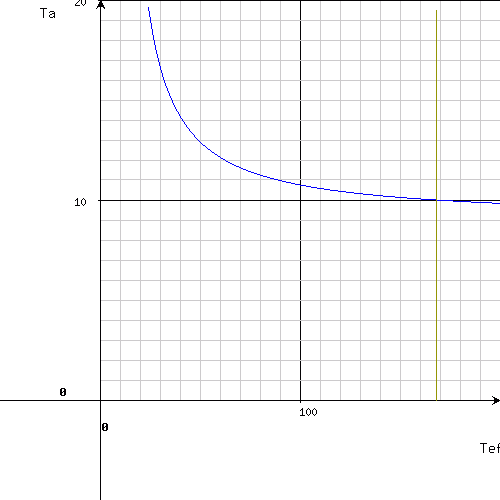
In this way, a suggested value of T(1/2)ef is 168 hours with a precision of half hour (± 0.5 h) and T(1/2)a about 10 hours. It is worthy to check this result further by narrowing of the range - for example: T(1/2)ef from 160 to 180 h and T(1/2)a from 9 to 11 h. After the redefinition of the ranges and re-sending of the step one, a new chart will be displayed:
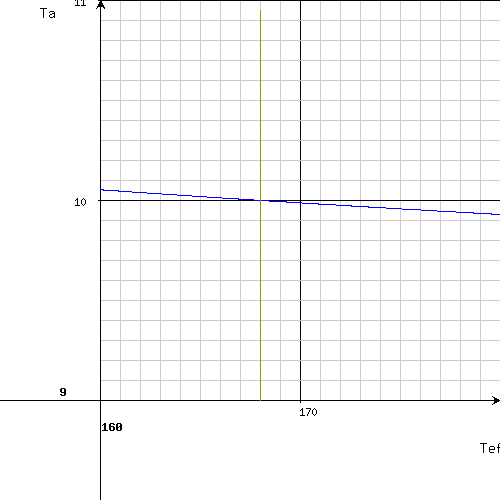
This result has a better precision (± 0.05 h). A high coherency of the F-factors calculated separately for each measure point additionally indicates at high correctness of the result. After entering of the values to the step two, a next chart is obtained (a 4. measure point - 96 h - was entered additionally):
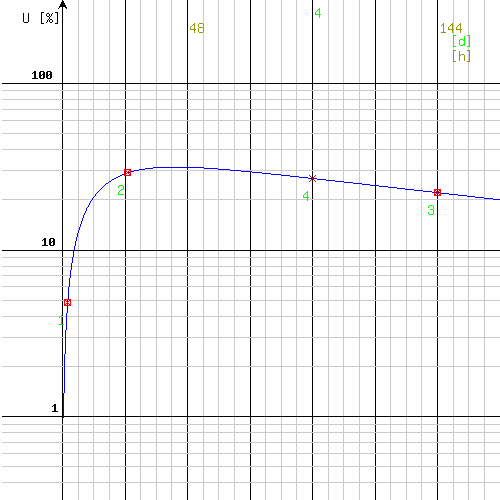
The displaying result shows the calculated parameters. Their correctness can be checked both on a chart and in the table. The entered uptake-values can be compared with the calculated ones in the given time points by use of the calculated formula parameters (entered in step two). The calculated ones are displayed with italics, using smaller and green fonts. Additionally, the uptake calculated for the additionally entered point 4 (96 h) is shown. The correction factor for the number of decays Cf compares the number of decays calculated with use of the proposed method to the traditional method based on the highest of the three entered values
Calculation of the dosis of radioiodine or another radionuclide for therapy (a modified variant of the Marinelli-formula - 6.)
With this program, you can calculate the dose of iodine-131 for therapy of benign thyroid disorders by use of the Marinelli-formula. Because
- calculate doses of other nuclides for other nuclide therapies,
- optimize the dosis by taking into account of the kinetics of the influx of the tracer into the organ.
The formula for the calculations is following:
| A = | 23.28 • m • D | • | ( | 193 | ) | • | ( | 1 | ) |
| | |||||||||
| U • T(1/2)ef | E | Cf |
m - target mass [g]
D - focal radiation dose [Gy], which should be reached in the above mass
U - radionuclide uptake [%]
T(1/2)ef - effective half time [d]
E - mean energy of the corpuscular radiation (i.e. α, β, conversion electrons) per one decay [keV]
Cf - correction factor for the number of radioactive disintegrations ("cumulated activity")
The first part of the formula (before the parentheses) consists of the known Marinelli formula. The second part (the first parenthesis) is for correction of mean kinetic energy of corpuscular radiation of the nuclide given. For I-131, the energy equals to 193 keV, and the entire second part reduces to one. The third part (the second parenthesis) is for correction of the number of radioactive disintegrations ("cumulated activity"), which comes from taking into consideration of the kinetics of the influx of the radiotracer into the organ. If the correction is not performed, the variable Cf equals to one, and the entire third part reduces to one.
Enter the following data:
- Target mass expressed in grams [g]; because, however, 1 g ≈ 1 ml (1 cm3) for the bulk of the tissues, and the volume is easier to be measured than
the mass, it is generally acceptable to enter the volume expressed in milliliters (cubic centimeters). - Radionuclide uptake expressed in percent [%]; if you use our programs (all five steps) for calculation of this parameter (option 4), enter the value described as "the maximal (measured-calculated) uptake of the therapy nuclide", even if it is much lower than the simulated value.
- Planned focal radiation dose expressed in greys [Gy] - radiation dose to be reached in the target mass.
- T(1/2)ef [d] - the effective half-time of the therapy nuclide expressed in days.
- Therapy nuclide - choose "131I" or "another".
- Mean particle energy expressed in kiloelectronovoltes [keV] - if you chose (above) nuclide different than 131I ("another"), enter this parameter. If you chose I-131, the parameter becomes automatically "181.9" (this is the mean kinetic energy of β-radiation emited by iodine-131 per one radioactive disintegration), and can be only modified in disabled java script. Such a modification will be, however, ignored by the server.
- Correction factor (Cf) - default: one.
Dosimetry of α- and β-radiation... (7.)
This program makes spossible to perform inverse calculations than the above ones (calculation of the radiation dosis delivered to the organ, if you know the T(1/2)ef, the mean particle energy, the mass of the tissue, in which the nuclide has been concentrated, and the quantity of the nuclide - expressed as a percentage of an activity).
Dose rate and absorbed dose of γ-radiation (8.)
This program is a dosimetry of gamma radiation: calculates the dose rate and the dose in a specified distance from a point source of a specified activity in a medium of a specified linear radiation attenuation coefficient; the source itself is assumed to have no attenuation.
You have to enter the following data:
- the activity of the radionuclide (specify the number, select the unit),
- distance from the source (must be higher than zero),
- γ-ray dose constant (Γ: specify the number, select the units; examples for the most common nuclides are given),
- buildup factor (B): if the linear attenuation coefficient is given, then B (higher than 1) makes possible to calculate the dosimetry of the broad beam geometry; default: 1 - reflects the narrow beam geometry circumstances,
- linear attenuation coefficient (narrow beam geometry for B=1 or broad beam geometry for B>1) or linear energy absorption coefficient (broad beam geometry for B=1); vacuum: 0,
- the nuclide half time (specify the number, select the unit); if not specified, than the absorbed dose cannot be calculated,
- exposition time (specify the number, select the unit); if not specified, it is assumed that it is infinite (the entire nuclide decays during the exposition).
As the result, you receive the dose rate at the beginning of the exposition (expressed in various units), and, optionally, the dose rate and the radionuclide activity at the end of the exposition time, as well as the absorbed dose.